
Happy Thursday, GoldBuzzers!
Rate-hike talk is back, and gold’s had a rough couple of days because of it. Today’s Real Talk crunches the data to find out what gold has done through every Fed hiking cycle since 1977, and the record is a lot more encouraging than this week’s headlines suggest.
Ok. Let’s get into it. ⬇️
The Scoreboard 🏆

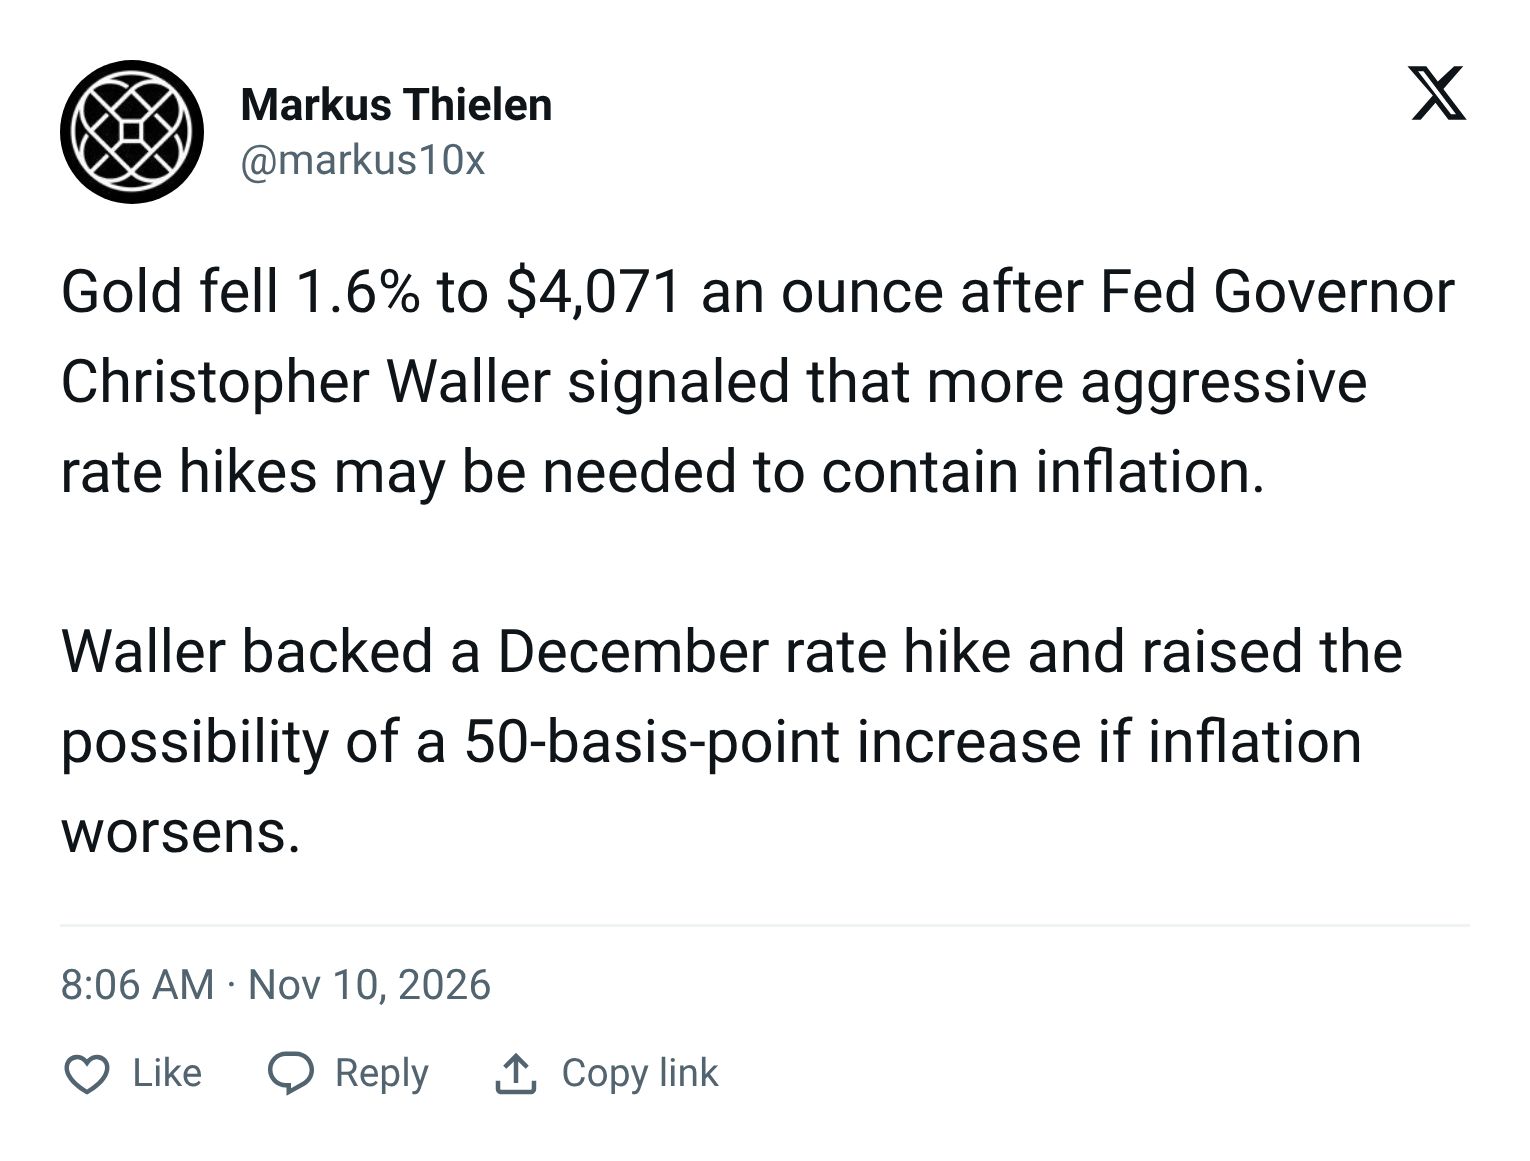
Gold couldn’t hold its early rebound on Wednesday, fading from the mid-$4,050s to close at $3,987 an ounce, back below the $4,000 mark, as markets kept digesting Tuesday’s inflation shock. US consumer prices rose 0.4 percent in October against forecasts of 0.3 percent, and that was enough for traders to fully price in a Federal Reserve rate hike next month, up from 84 percent odds before the report.
A growing minority now expects a larger half-point move, and Fed Governor Christopher Waller has said exactly that could be warranted if core inflation keeps running this hot. The tough talk from Waller and his colleagues pushed the US dollar to its highest level since April 2025, and firmer oil prices on fresh Strait of Hormuz tensions didn’t help the inflation picture either. Higher rates and a stronger dollar make life harder for gold, which pays no interest, so the metal spent the session grinding lower. Silver managed a small gain, clawing back some of Tuesday’s losses to close at $51.76 an ounce, a rare day where the white metal outpaced gold on the way through rough weather.
Real Talk 🎯

Does a Fed rate hike spell trouble for gold?
Gold had a bad day on Tuesday. The October inflation report came in hotter than expected, with consumer prices up 0.4 percent in a month when economists were looking for 0.3 percent. Gold dropped more than two percent by the close, and on Wednesday it slipped back under $4,000 after briefly trading above $4,060. Silver held up better, gaining more than two percent on Wednesday.
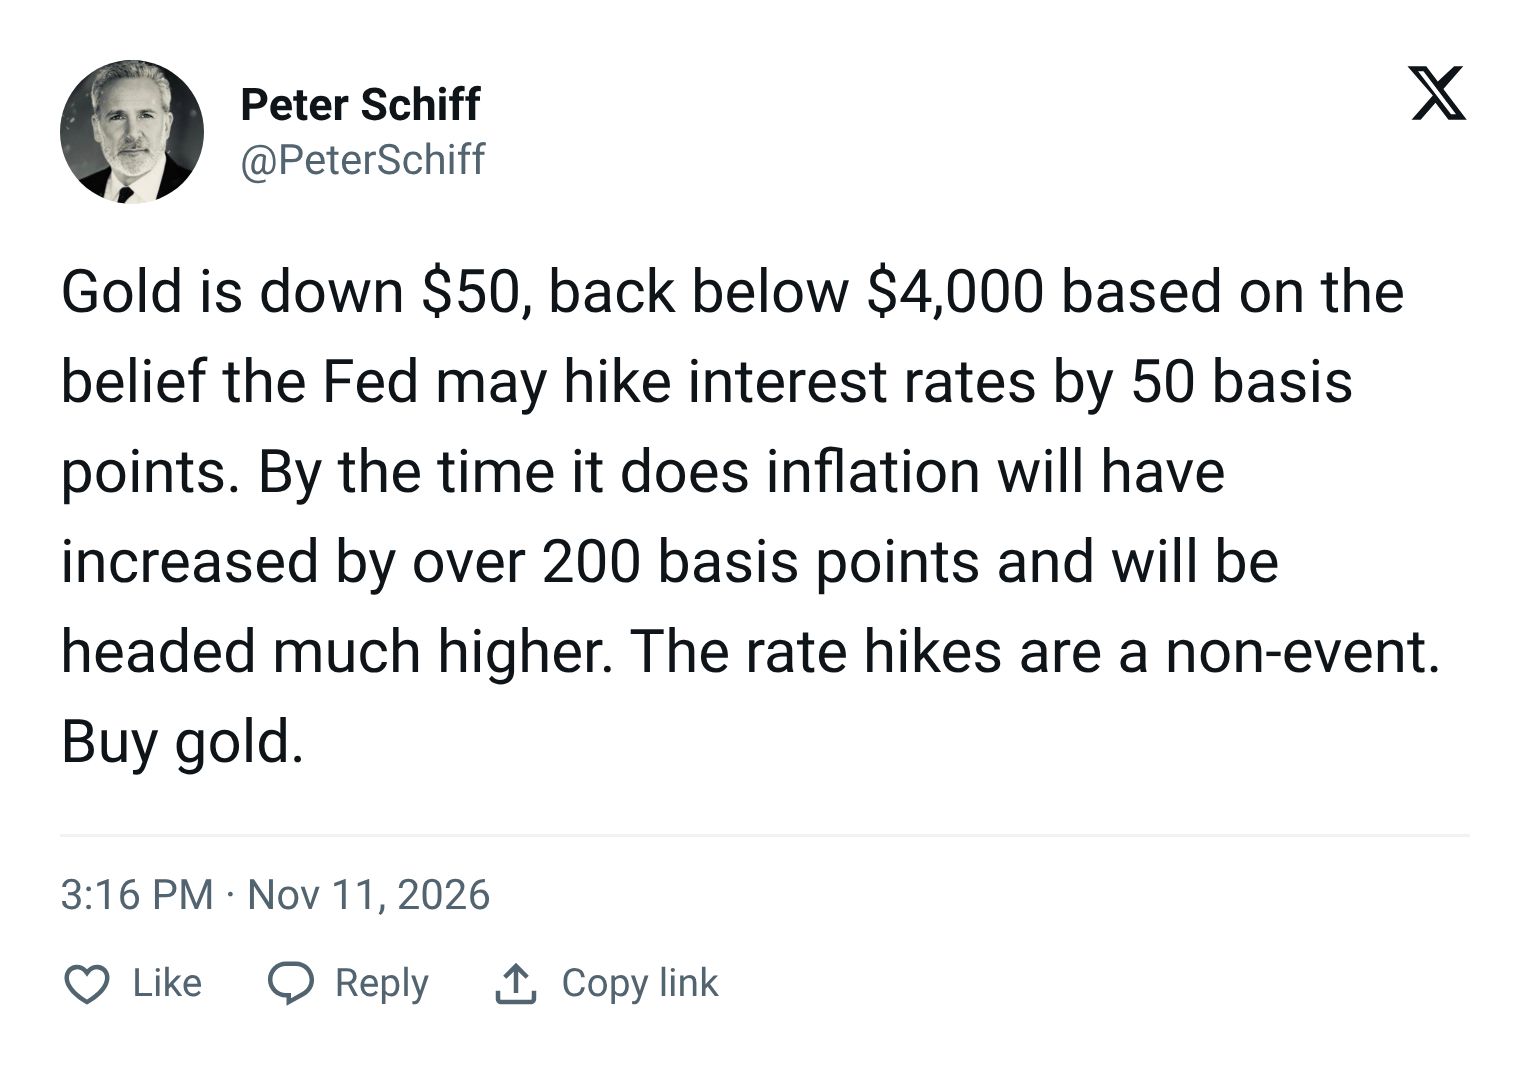
What rattled the market was the Federal Reserve. The Fed raised interest rates in September for the first time since 2023, and it now looks almost certain to raise them again in December. Fed Governor Christopher Waller said this week he’s leaning toward a quarter-point hike, but that a half-point move should be considered if inflation stayed this hot, which it did. Dallas Fed President Lorie Logan went further, saying she thinks at least two more hikes are needed.
Gold is roughly a quarter below its January record of $5,420, though most of that drop happened months before the Fed’s first hike. This is the consolidation phase of a long bull market, and rate-hike fears are the latest reason for it.
Why rate hikes worry gold owners
Gold doesn’t pay interest. When rates rise, cash and government bonds pay more, and holding gold means giving that income up. That’s the case against gold right now, and it’s a fair one. Goldman Sachs cut its end-of-2026 gold forecast last week from $4,650 to $4,150, with a more aggressive Fed as the main reason.
What history says
The argument makes sense on paper, but it doesn’t match what gold has actually done when the Fed raises rates.

Gold rose in five of the Fed’s eight completed hiking cycles since 1977. The two big losses, in 1983-84 and 1988-89, came when rates were far above inflation. Fed hike dates from the Federal Reserve (dates before 1994 are approximate).
The Fed has been through eight rate-hiking cycles since 1977, plus the one that started in September. Measured from the first hike to the last, gold rose in five of them. In the late 1970s, as the Fed pushed rates into the high teens, gold rose 259 percent. During the 17 back-to-back hikes of 2004-06, it gained 52 percent. In 2015-18 it rose 16 percent, and its low came the day after the very first hike.
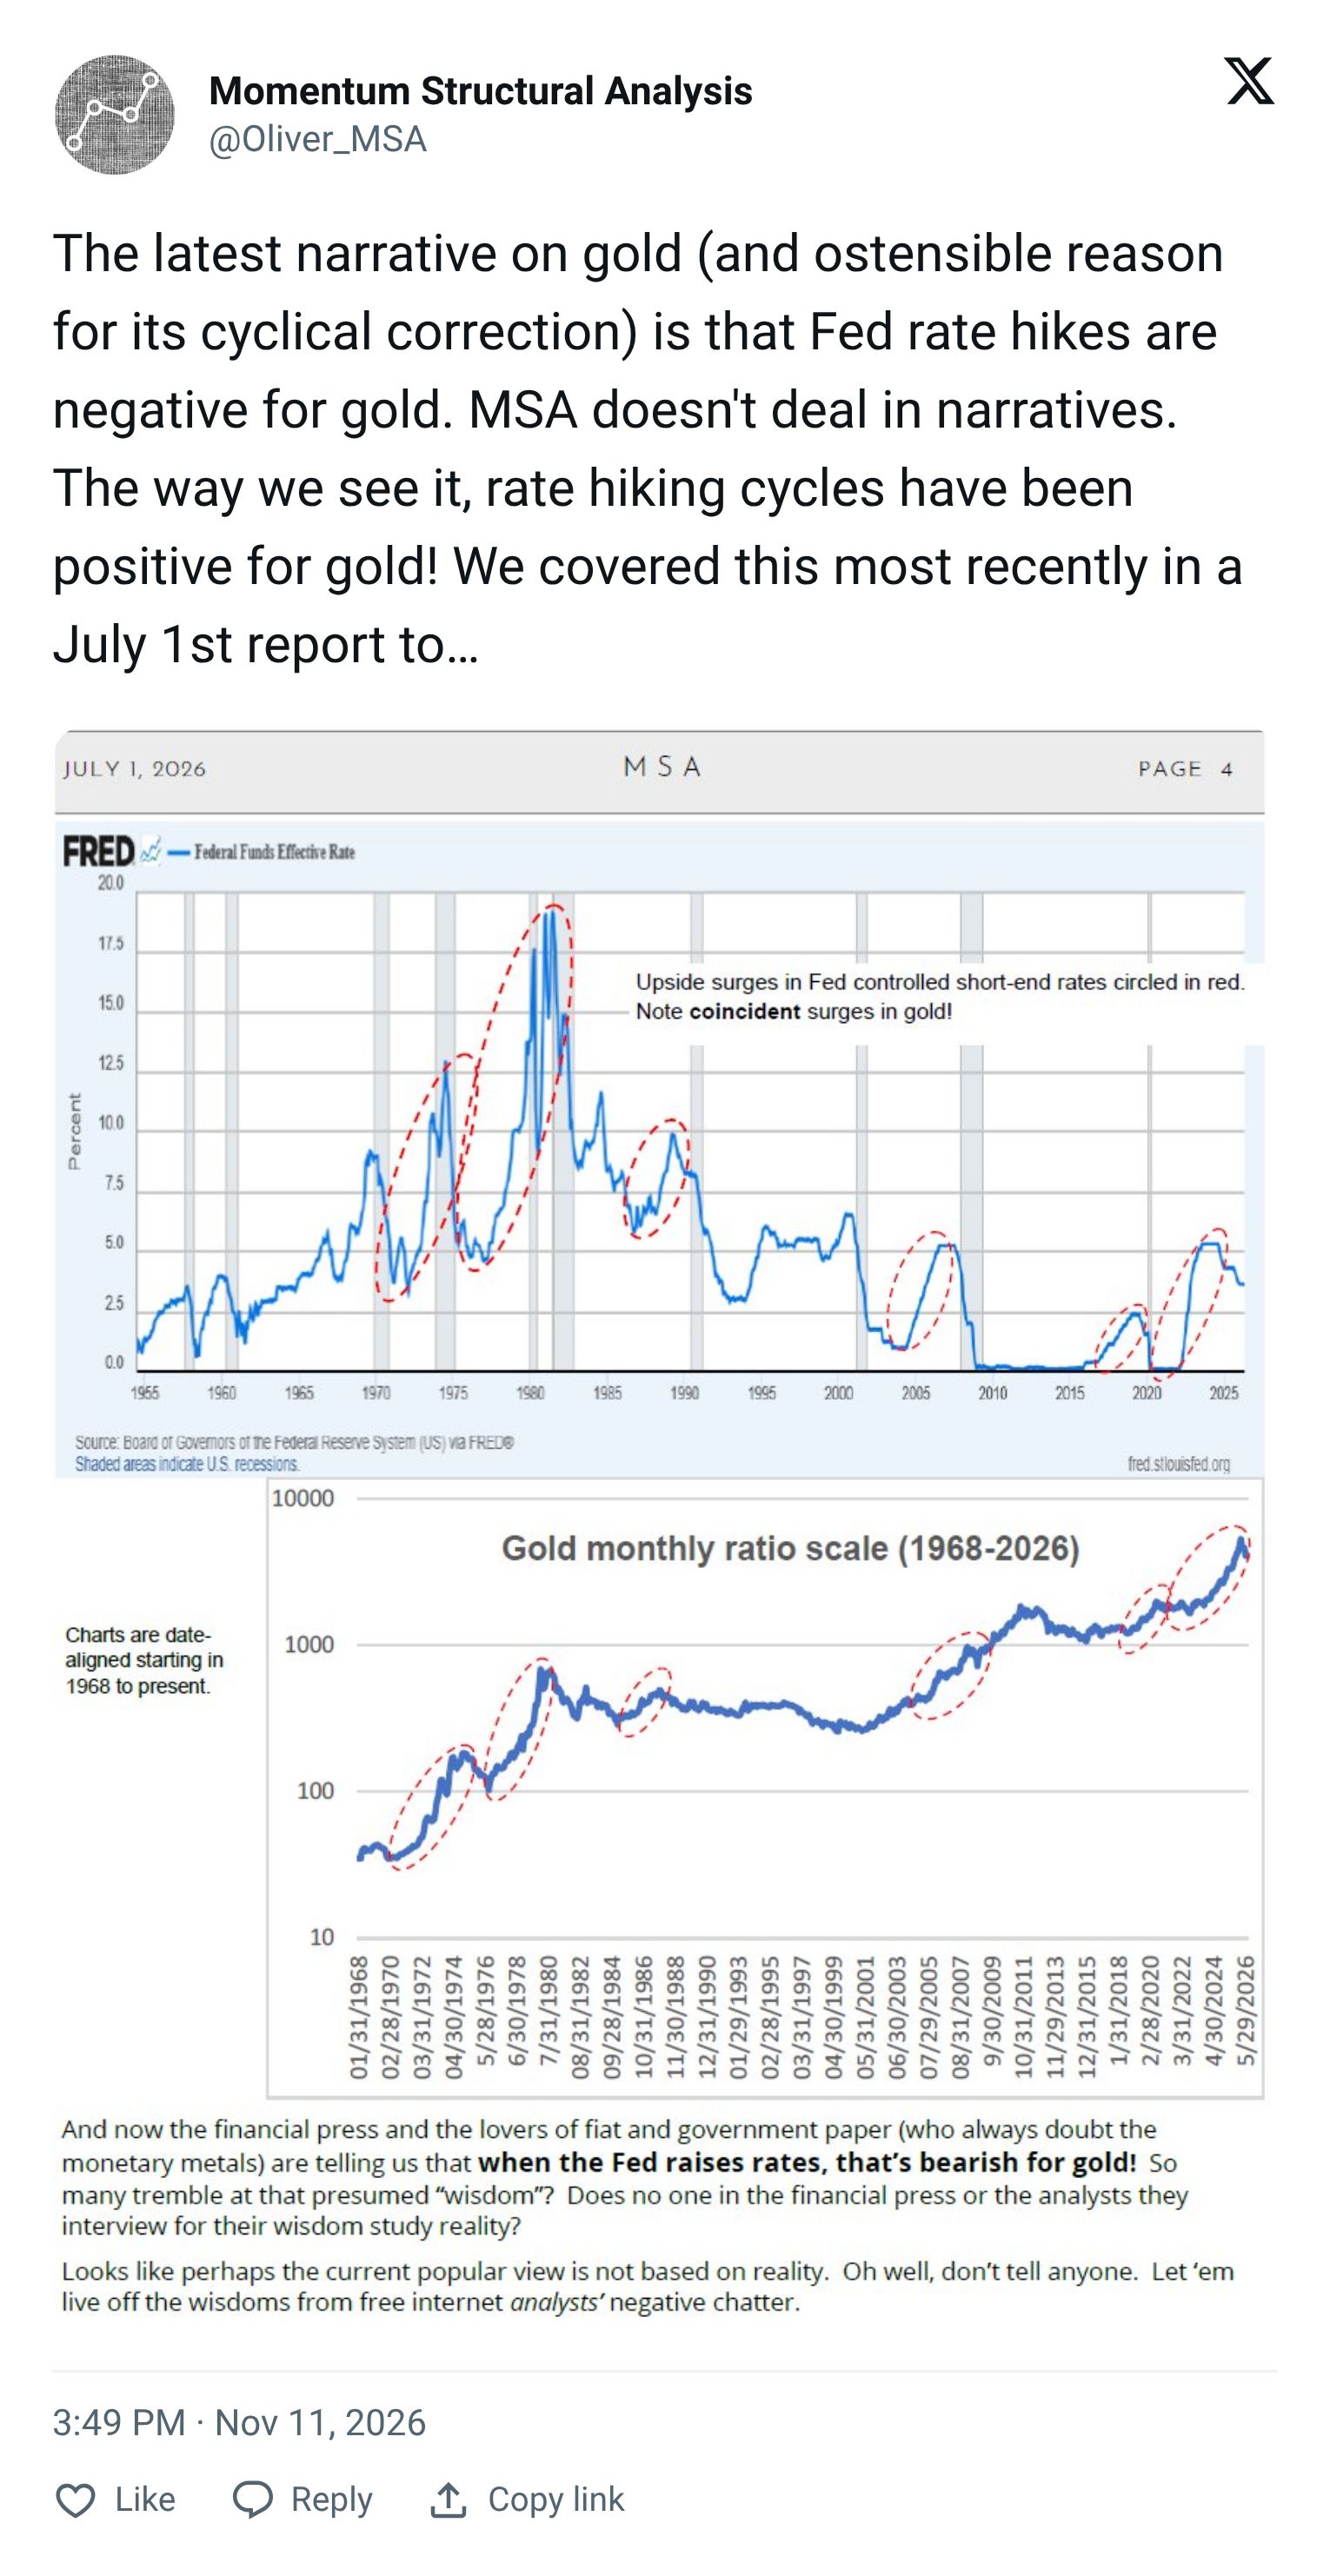
Gold did fall hard twice, in 1983-84 and 1988-89, and both times it lost close to a fifth of its value. Those two cycles have something in common, and it comes down to what economists call the real interest rate. That’s simply the interest rate minus inflation. If your savings account pays four percent and prices rise three percent, you’re only one percent better off.
In 1984 the Fed’s rate was around 11 percent while inflation ran near four percent. Savers were earning about seven percent a year after inflation, and gold couldn’t compete with that. Today the Fed’s rate is under four percent, and with inflation running hot, the real return on cash is a fraction of what it was then.
The 2022 lesson
The cycle that looks most like today is 2022. The Fed raised rates at its fastest pace in four decades, and gold fell 16 percent in the first six months.
Then gold hit bottom in late September 2022, with the Fed still raising rates and another ten months of hikes still to come. From that low, gold went on to more than triple by this January.

In 2022, gold bottomed six months into the hiking cycle, with ten more months of hikes still to come. This year’s cycle is two months old. Fed hike dates from the Federal Reserve.
Gold in 2026 has tracked a similar path so far, down about seven percent since September’s hike. That isn’t a forecast, but it’s a reminder that gold has usually found its floor while the Fed was still hiking, well before it stopped.
Who’s buying the dip
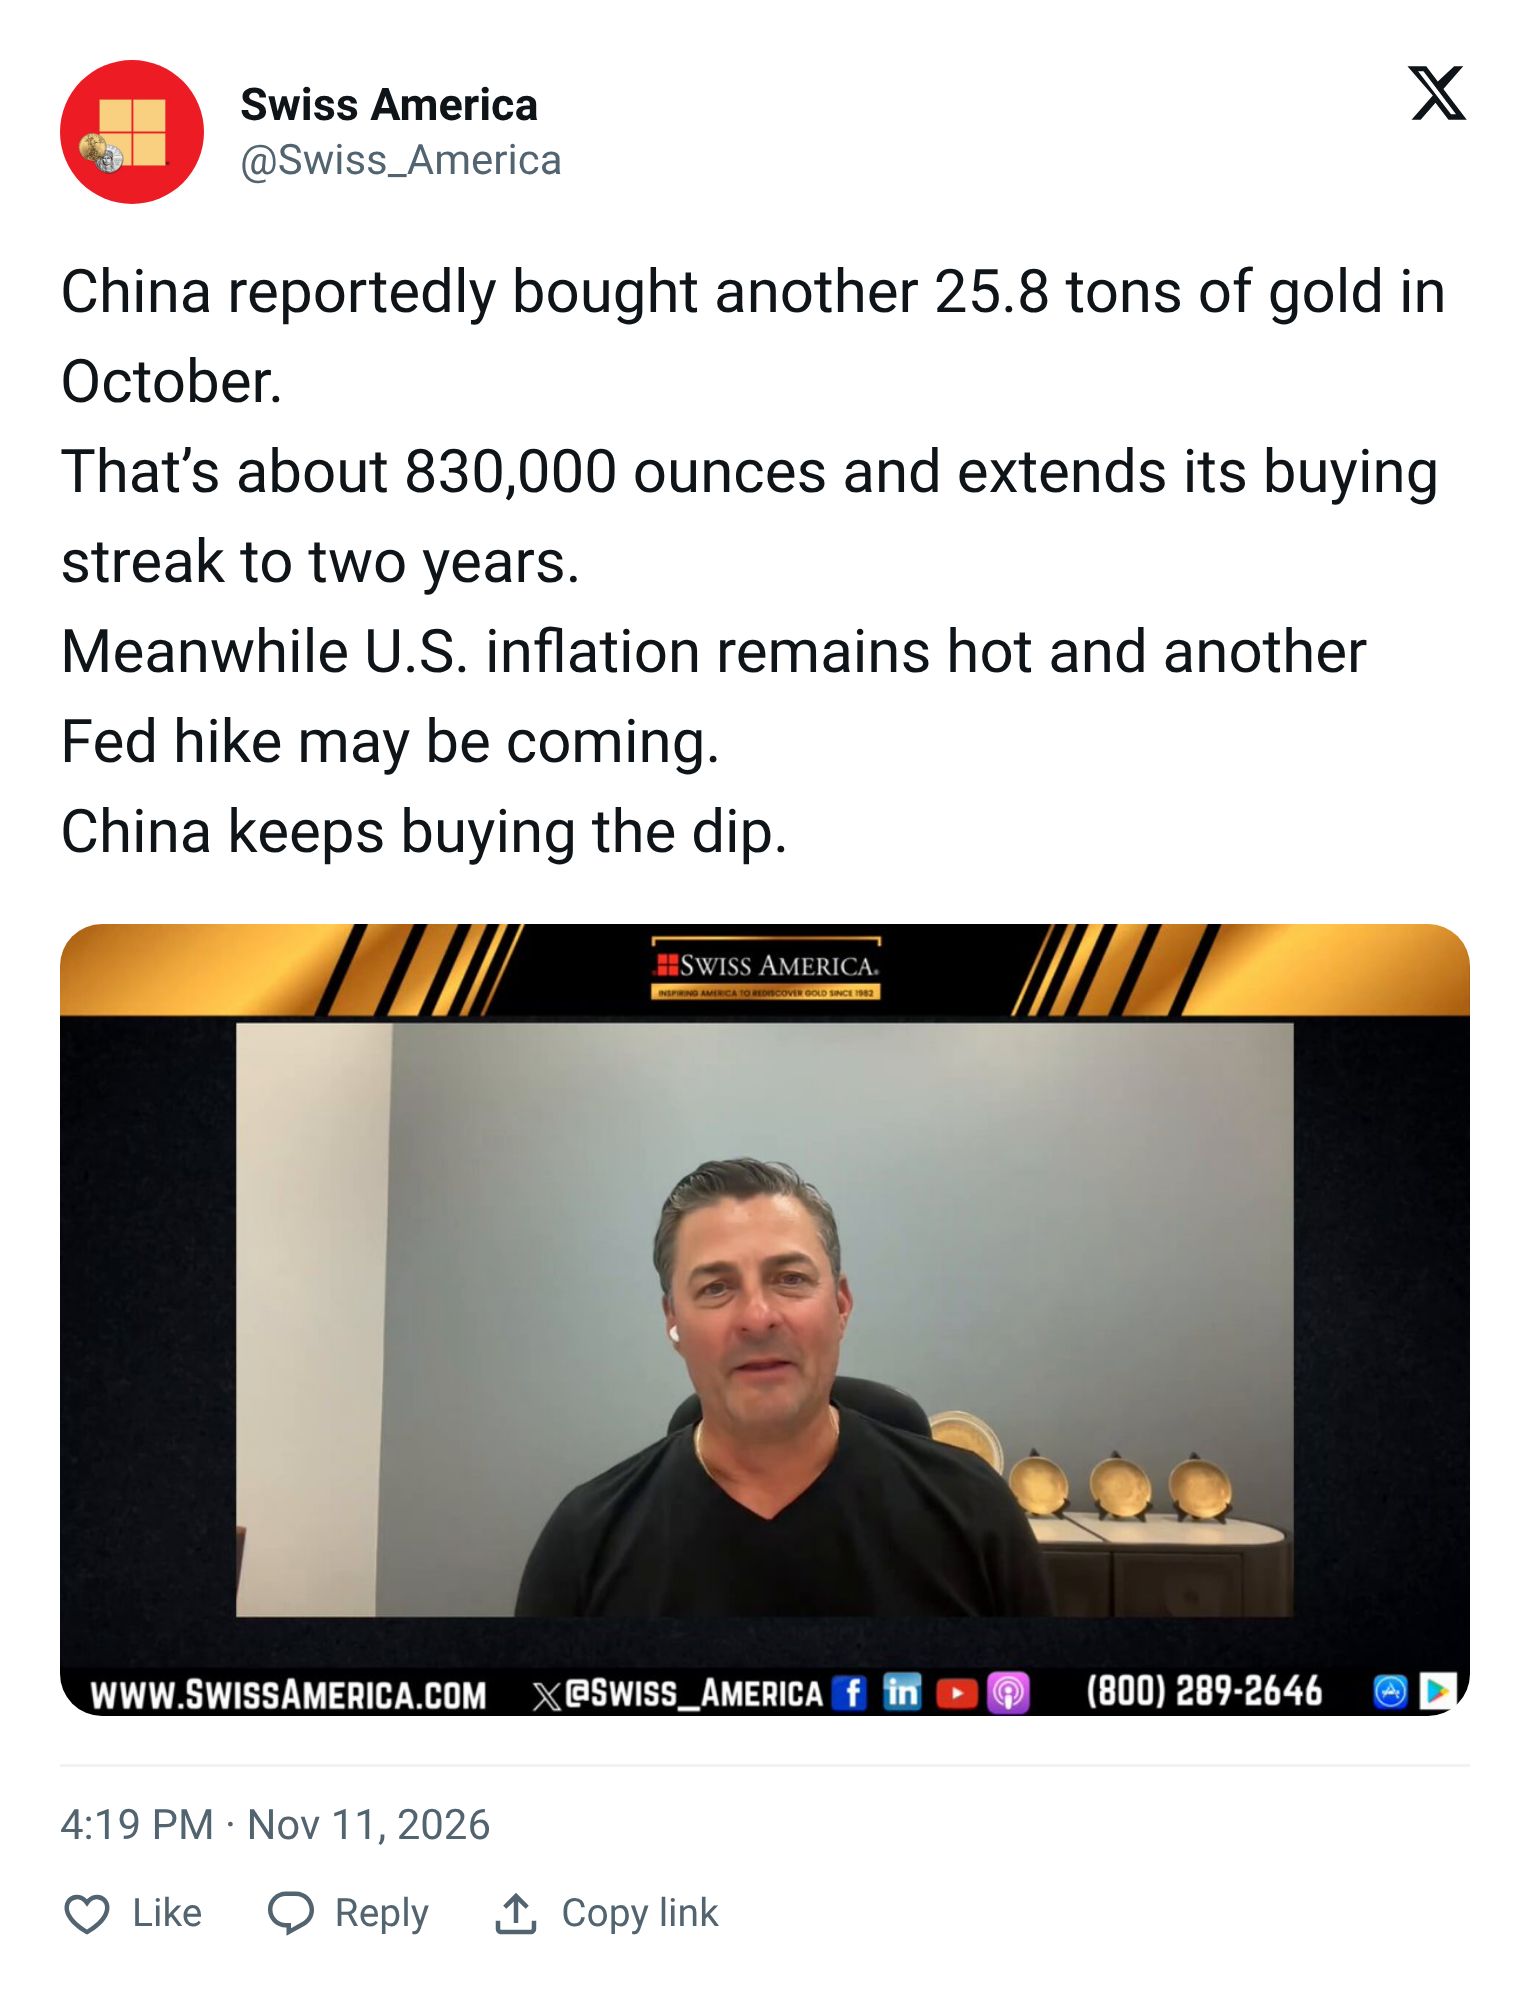
Central banks have been using lower prices to buy. China’s central bank added 830,000 ounces of gold in October, or about 26 tonnes. That’s its 24th straight month of buying and its biggest monthly addition since September 2023, and it came while prices were falling.
Even while cutting its forecast, Goldman expects central banks worldwide to keep buying around 60 tonnes a month. Before 2022 the average was 17.
The big picture
Rate hikes make headlines, and they can knock gold back for months at a time. But the hiking cycles that did real damage were the ones where the Fed pushed rates far above inflation, paying savers around seven percent a year after rising prices. To get anywhere near that today, the Fed would have to more than double rates from under four percent, at a time when it’s still trying to catch up with inflation.
Meanwhile, China’s central bank stepped up its buying as prices fell. This week’s selloff is part of the consolidation phase, and the bull market that began in 2024 still has years to run.
📦 Recommended Resources
Here are some of the companies I personally use and recommend:
Allocated Storage - BullionVault
🇺🇸 Gold IRA - My quick guide to Gold and Silver IRAs
🇨🇦 🇺🇸 Physical Delivery - Silver Gold Bull, Sprott Money
🔒 Where the signals stand
Rate-hike fears have made this a nervy few weeks for metals, and silver has taken the hardest knocks.
On September 23, with silver at $64.44, INSIDER’s Silver Min Risk signal moved out of the market. Silver has since dropped to around $52, a fall of nearly 20%, and the signal has stayed out the whole way down. It’s still out today.
The harder call is when to get back in. When the signal changes, members will see it on the members’ page the morning it happens.
It’s what I use for my own investments.
14-day money-back guarantee. Cancel anytime.
That’s all for this Thursday, folks. I’ll see you on Sunday.
Before you go, please take a moment to rate today’s newsletter and tell us how we did.
What did you think of today's GoldBuzz?
GoldBuzz INSIDER The System I Use for My Own Investing
GoldPrice.Live Live Prices, Charts and News 24/7
The Gold Awakening Download Your Free Copy Here
Enjoyed today's issue? Forward it to a friend who needs more gold in their life. They can subscribe at goldbuzz.com
Got feedback? Hit reply and let me know what you loved (or didn't).
Rick Adams
Founder, GoldBuzz
rick@goldbuzz.com
